Deep Dive · Sep 22, 2026 · 7 min read
Measuring GenAI Quality: Offline Evals, Online Metrics, and A/B Tests
A measurement stack for GenAI: golden sets, model judges, production signals, and controlled rollouts.
 Short version← How to Measure Whether Your GenAI Project Is Working
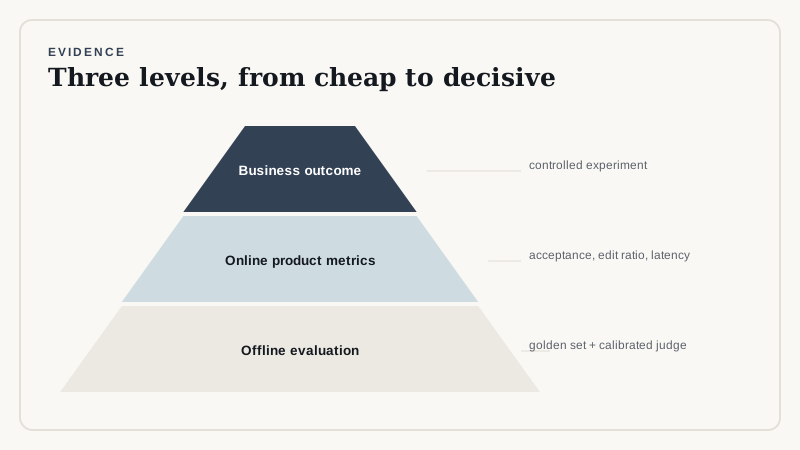
Measurement for GenAI has three layers: offline evaluation for fast iteration, online metrics for real behavior, and controlled experiments for business impact. Each answers a different question.
Offline: the golden set
Curate real inputs with reference outputs or grading rubrics. Keep it versioned, stratified by task type, and refreshed with new failures from production.
{"id": "q-118", "input": "What is our refund window for annual plans?",
 "reference": "30 days from purchase",
 "rubric": ["states 30 days", "mentions annual plans", "no invented exceptions"],
 "tags": ["billing", "policy"]}
Offline: model-as-judge
A strong model can grade outputs against a rubric at scale. Calibrate it: have humans grade a sample, compare agreement, and adjust the rubric until they match. Spot-check periodically, since judges have biases such as favoring longer answers.
JUDGE = """Grade the ANSWER against the RUBRIC. For each rubric item return 1 if satisfied else 0.
Return JSON: {"items": [0 or 1, ...], "notes": "<one sentence>"}"""

def judge_score(gateway, answer, rubric):
    msg = [{"role": "system", "content": JUDGE},
           {"role": "user", "content": f"RUBRIC: {rubric}\nANSWER: {answer}"}]
    out = json.loads(gateway.complete("judge", "large", msg, temperature=0).text)
    return sum(out["items"]) / len(rubric)
Online: logged signals
- Acceptance rate: how often users keep the output as is.
- Edit distance: how much users change it.
- Escalation or fallback rate.
- Latency percentiles and cost per request.
- Explicit thumbs up or down, which is sparse but informative.
Controlled experiments
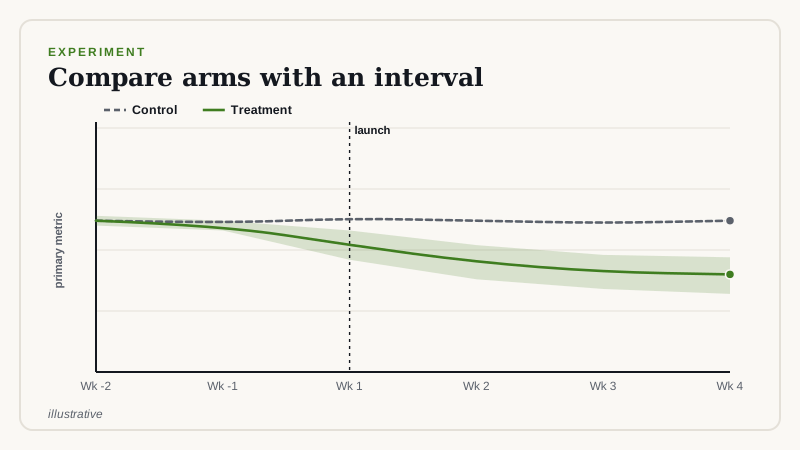
To prove business impact, randomize users or tickets between the old process and the new one, and compare the outcome metric, such as handling time or resolution rate. Decide the sample size and the primary metric before starting.
import hashlib

def bucket(user_id, experiment, treatment_share=0.5):
    h = int(hashlib.sha256(f"{experiment}:{user_id}".encode()).hexdigest(), 16)
    return "treatment" if (h % 10_000) / 10_000 < treatment_share else "control"
Hash-based assignment keeps each user in the same arm across sessions. Watch for novelty effects, and run long enough to cover weekly cycles.
Guardrail metrics
Track things that must not get worse, such as complaint rate or error rate, and stop the experiment if they cross a threshold.
Choosing the primary metric
Pick one primary metric that reflects the business goal, plus a few guardrails. For a support copilot the primary might be median handling time and the guardrails customer satisfaction and reopen rate. For document Q&A it might be the share of questions answered correctly with a valid citation. Resist reporting twenty numbers; a single clear metric makes decisions possible.
Sample size and significance
Small samples mislead. Before running an experiment, estimate the effect size you care about and the variability of the metric, and compute the sample you need. If you cannot reach it, treat the result as directional, and say so.
import math

def sample_size_per_arm(std_dev, min_detectable_diff, z_alpha=1.96, z_power=0.84):
    """Approximate n per arm for comparing two means (two-sided 5% level, 80% power)."""
    return math.ceil(2 * ((z_alpha + z_power) * std_dev / min_detectable_diff) ** 2)
Pitfalls in online experiments
- Novelty effects: usage spikes at launch, then settles; run long enough to see the steady state.
- Contamination: users share tips across arms, so randomize by team where that happens.
- Selection bias: volunteers differ from average users; random assignment avoids it.
- Metric gaming: if people are rewarded on a metric they can influence, pair it with a quality check.
Qualitative signals
Numbers show what; interviews show why. Talk to five or six users each month about where the tool helps and where it irritates them. Tag themes and compare them with the quantitative data. Often a single missing feature explains a plateau in adoption.
A reporting template
- What we changed, and why.
- The primary metric with an interval, compared to baseline or control.
- Guardrail metrics.
- Top failure categories and what we are doing about them.
- Decision requested.
Keeping the evaluation honest
Protect the held-out set from tuning, refresh it with new production failures, and record every evaluation run with the exact configuration. When someone reports an improvement, ask whether it holds on data the system has never seen.
How we can help
We design the measurement stack for your use case, build the golden set with your experts, and run the experiment so the result stands up to scrutiny. Ask us for a measurement plan.
Related reading
Need help implementing this?
Our consultants run architecture reviews and build production pilots. Book a free scoping call to talk through your design.
Book a Free Scoping Callor email us at hello@deepvero.com